The Conflict Reignites, and We Turn Toward Home

Oil retreated even as the Iran conflict stayed fragile, inflation reaccelerated, the Fed held a fourth straight time, the AI buildout kept reshaping the cost curve, and we’re turning our focus home to Chicago. Here’s what stood out in June, and how we’re reading it.
June gave us more of the same story: precariousness, volatility, stubbornness, and mixed signals. The Middle-East truce stayed fragile, oil retreated, yet May CPI still pushed up to 4.2%. Under new Chair Kevin Warsh, the Fed held a fourth straight time, and the cost conversation widened from oil to the AI buildout. Underneath the macro noise, the most interesting story for us this month was local: Chicago is outperforming on several measures we care about, and we’re leaning back into our hometown.
Oil Retreats, but Capital Costs Stay Stuck
Oil retreated through June even as the geopolitical backdrop remained fragile. A tentative U.S.–Iran truce frayed late in the month, with renewed attacks and U.S. strikes flaring again around June 26–27. Brent fell from its April spike near $138 a barrel to roughly the low-$70s by late June, erasing much of the spring war premium[16]. Still, we see the physical market as unsettled: renewed regional tensions and an incomplete return to normal Strait of Hormuz traffic keep energy risk in our underwriting conversation.
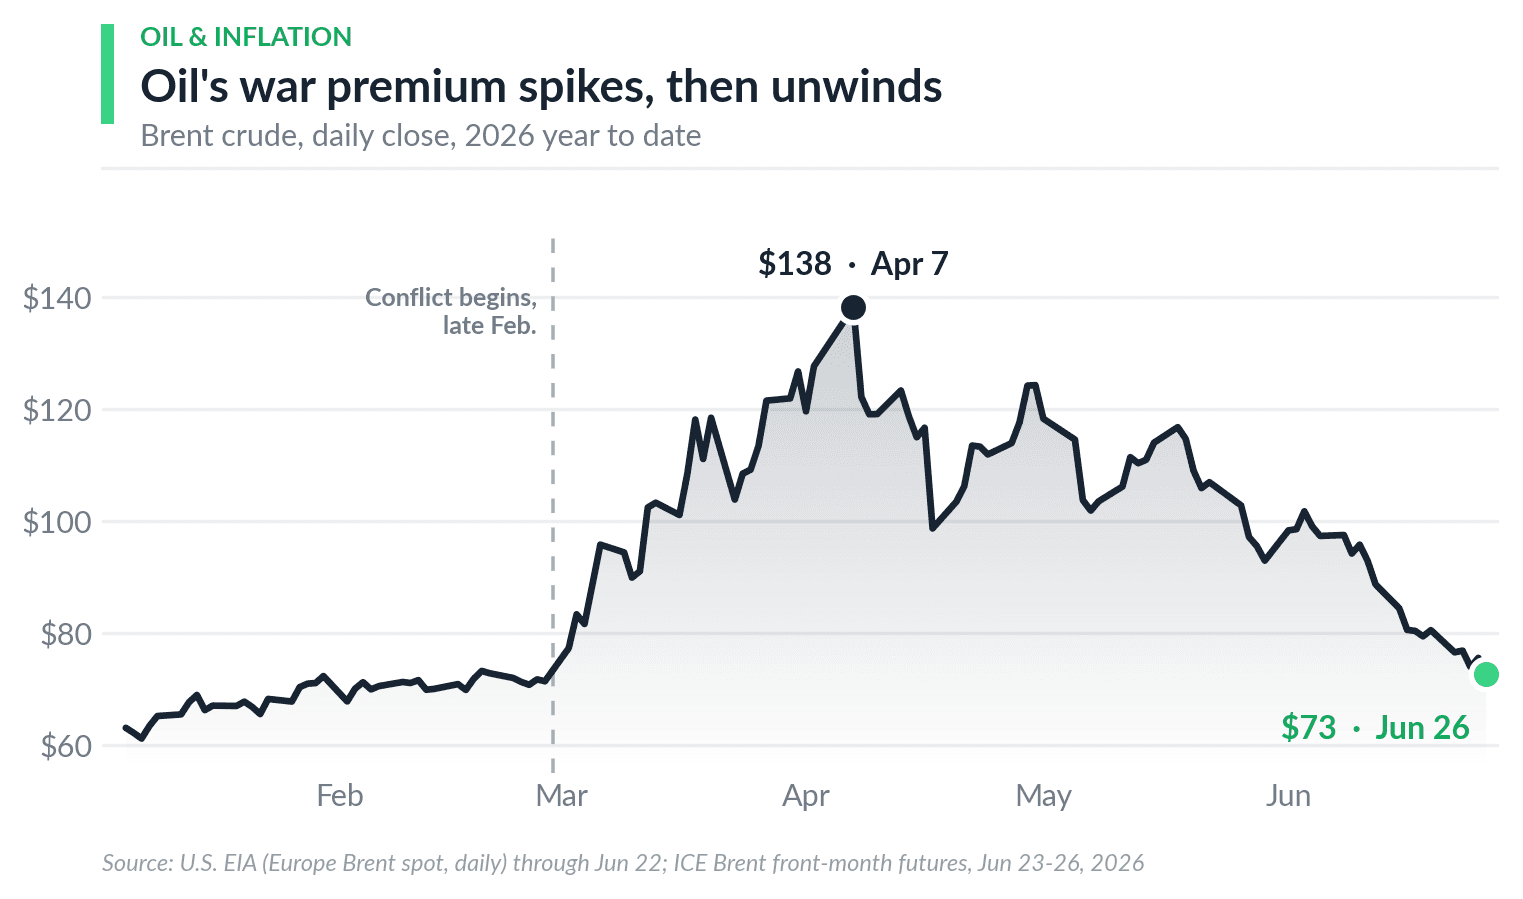
Brent spiked to about $138 a barrel in early April, then retreated to roughly the low-$70s by late June as the spring war premium unwound.
Against that backdrop, the Federal Reserve held the federal funds rate at 3.50–3.75% on June 17[15]. It was the committee’s fourth consecutive hold of 2026 (after January, March, and April), and the internal lean remains hawkish: even with oil now retreating, sticky shelter and services make near-term cuts harder to underwrite. The 10-year Treasury traded around 4.4% in late June[1]. For our underwriting, the message is unchanged and now firmer: we underwrite to today’s capital costs, and rate relief is no longer a base-case underwriting assumption.
Nothing captures the shift better than the forward SOFR curve, the market’s pricing of future short-term rates that underpins floating-rate debt. It has moved meaningfully higher since January. Based on dated Pensford forward-curve snapshots reviewed by Oakdale, the market-implied path for 1-month Term SOFR shifted from pricing cuts in January to a higher-for-longer path by late June, an upward repricing of roughly 80 basis points that we regard as approximate. For floating-rate debt, the practical implication is simple: rate relief is no longer a base-case underwriting assumption.[10]
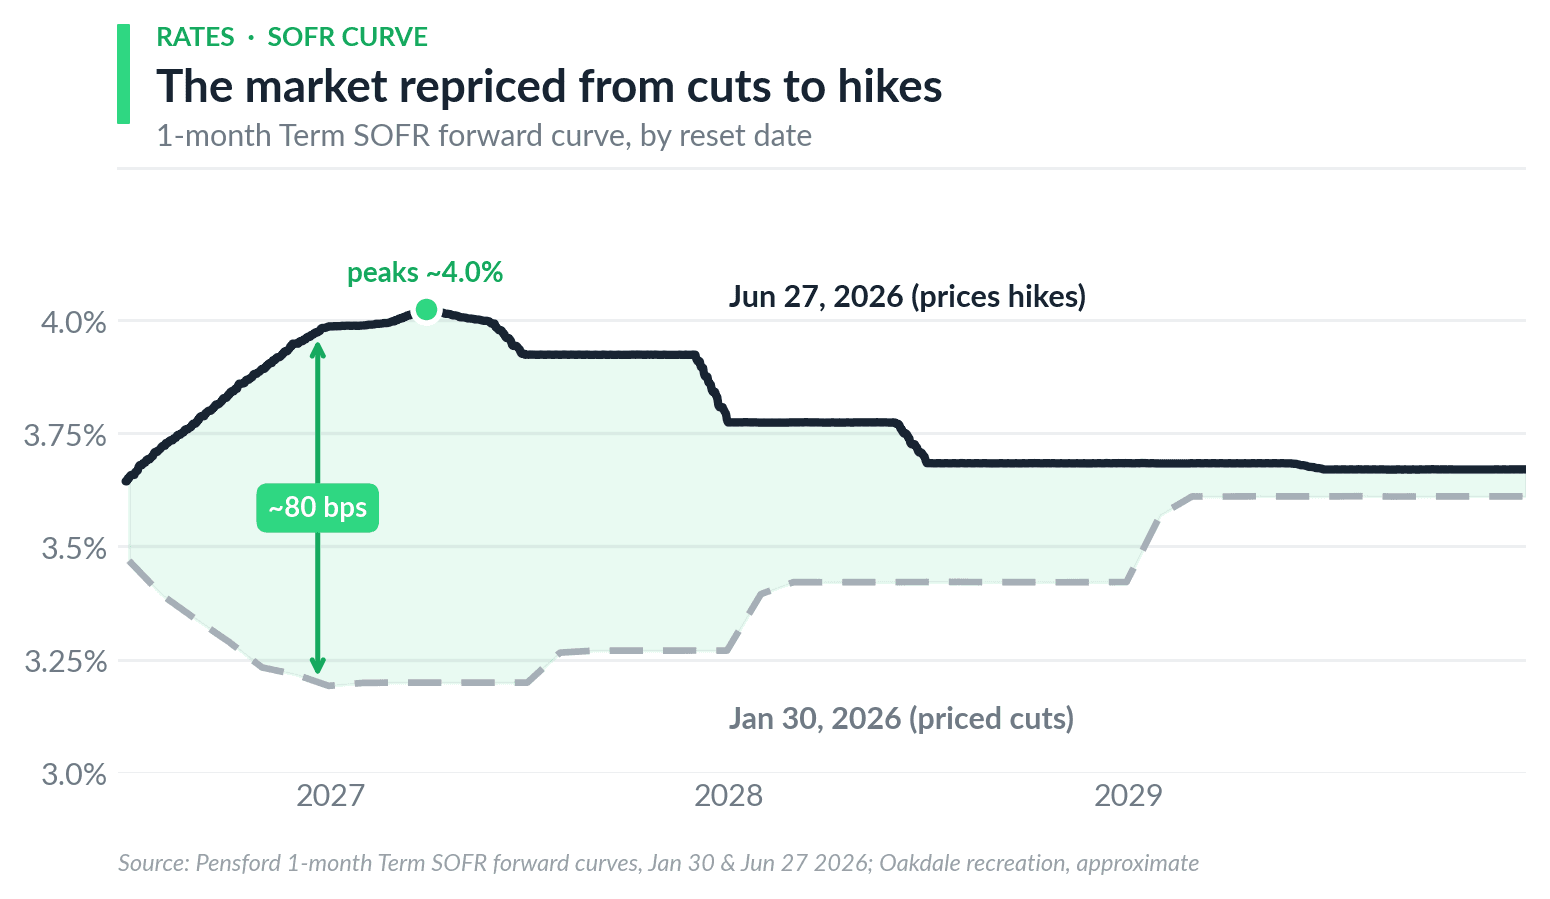
The 1-month Term SOFR forward curve repriced higher between Jan. 30 and Jun. 27, 2026, from pricing cuts to a higher-for-longer path.
The practical effect is tangible: the rate cap that looked expensive in January now looks cheap, and any business plan built on lower rates has to be rebuilt at today’s curve.
Even so, apartments keep trading. National deal volume held roughly steady over the trailing year at about $125 billion, up just 0.6%[2]. Liquidity is returning, but selectively, and it’s concentrating where investors have real conviction.
That selectivity is exactly where a disciplined, local buyer has an edge.
Chicago: Coming Home
The clearest conviction trade on our desk right now is in our own backyard. Three things are happening in Chicago at once, and they line up unusually well.
Rents are up. Chicago rent growth has outpaced the national average since 2023, with vacancies staying tight[2]. Construction is down. According to CoStar, developers started 5,725 units in the 12 months through Q2 2026, essentially flat year over year, even as national starts fell about 23%. That’s roughly one-third below the city’s 10-year average of about 8,500 units and down 19% from the late-2025 peak. Just 1.6% of Chicago’s supply is under construction versus 2.7% nationally, and deliveries ran under 1% of inventory versus 2.2% nationally[3].
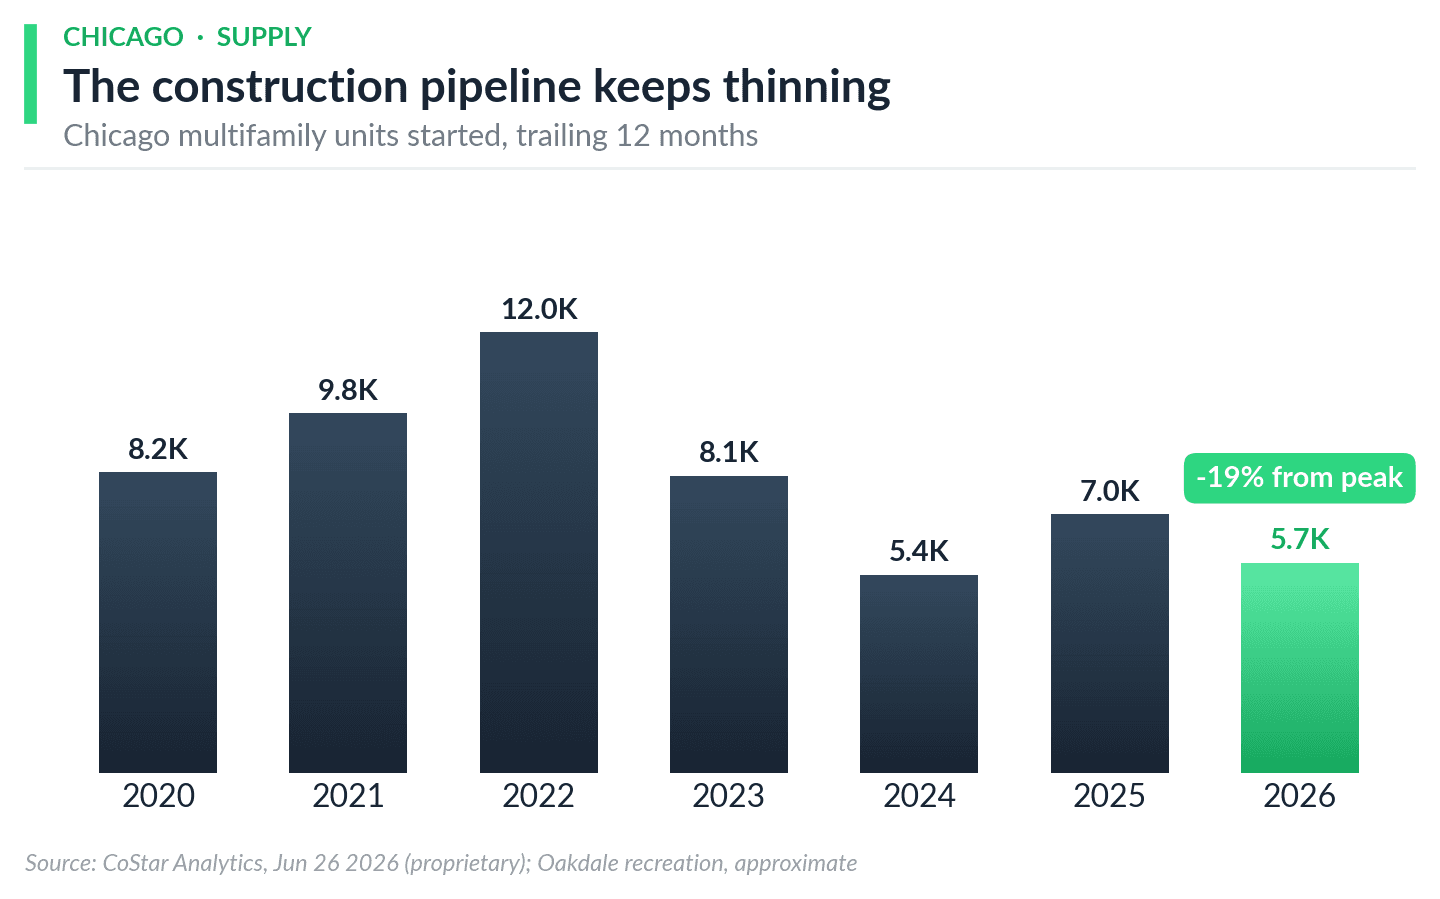
Construction starts have moderated to about 5,725 units, roughly a third below the 10-year average and down 19% from the late-2025 peak.
Transactions are up. Per CoStar, Chicago apartment sales reached $6.4 billion over the past year, up 34% against a national market that grew just 0.6%, the highest level since 2022, ranking Chicago among the most active apartment markets in the country. Downtown and the North Lakefront led with about $2.4 billion, nearly 40% of all activity, and downtown volume alone jumped 73% to $1.4 billion[2].
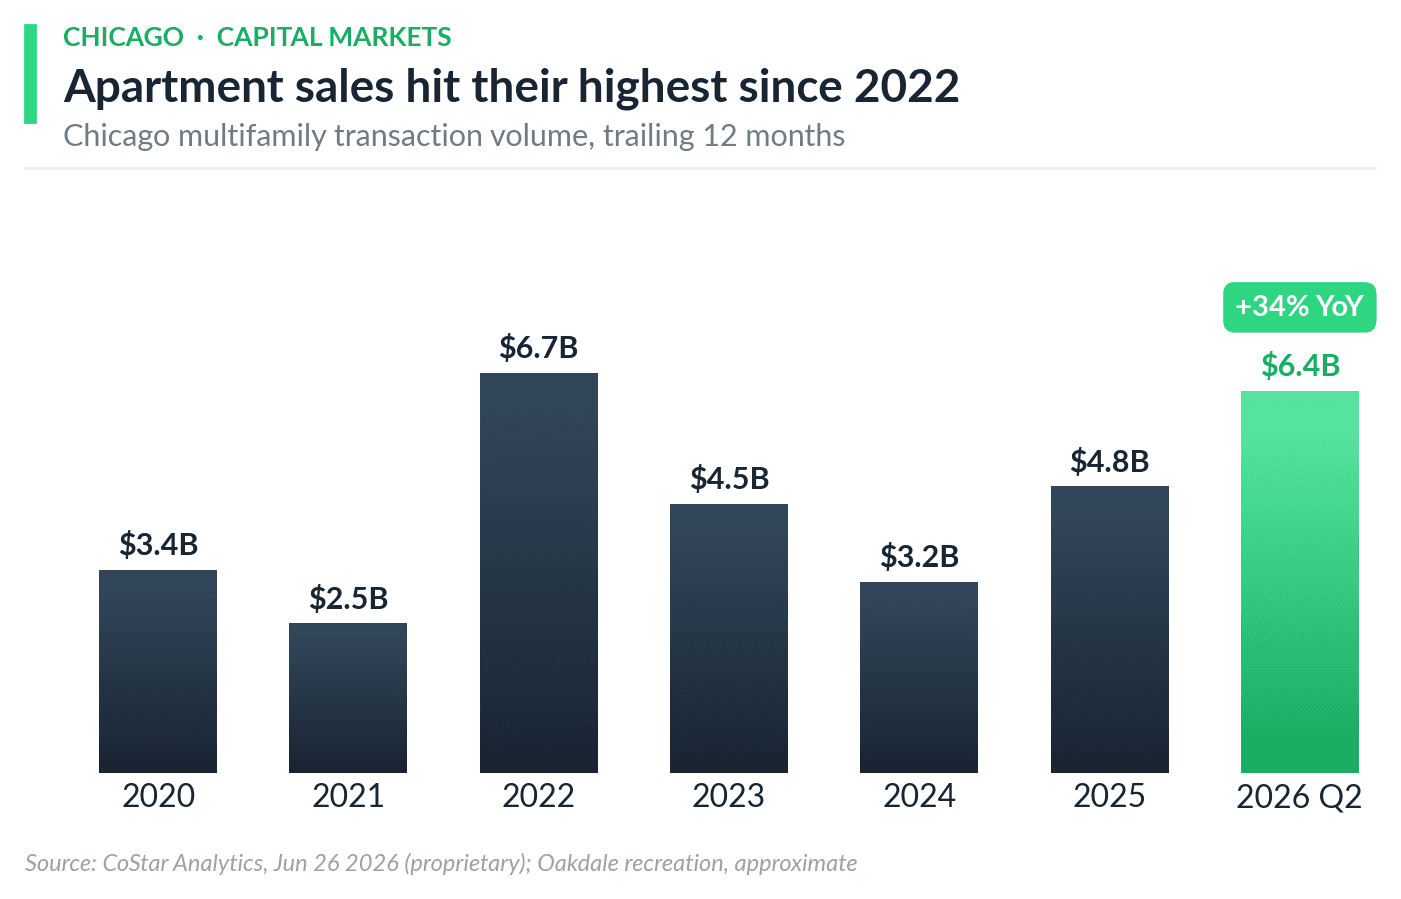
Chicago apartment sales reached about $6.4B over the trailing year, up 34% and the highest level since 2022.
Rising rents, a structurally thin pipeline, and improving liquidity, in the market we know better than any other. We’re renewing our focus on Chicago, with several acquisitions and adaptive reuse projects under active evaluation. Adaptive reuse is a particularly good fit here: when ground-up supply is constrained and expensive to deliver, converting and repositioning existing buildings lets us add housing at a basis ground-up construction struggles to match.
This is the setup we look for, and it happens to be home.
Dallas-Fort Worth Finds Its Footing
We have written about Dallas as a cautionary tale on overbuilding, so it is worth marking where the Metroplex now stands, because the fundamentals are quietly turning. In the first quarter renters absorbed about 8,500 units across Dallas-Fort Worth, roughly a thousand more than developers delivered, with Dallas proper driving about 70% of the demand. Vacancy ticked down to 6.8%, and asking rents edged back into positive territory at $1,483 a month after a soft 2025. The split by quality is telling: Class A rents rose 3.2% over the year and Class B turned positive for the first time since 2023, while Class C kept slipping, down 4.2%[17].
The bigger story is supply. Deliveries have been roughly flat for three straight quarters, the construction pipeline has fallen about 43% from its 2023 peak, and only about 23,000 units are expected to deliver in 2026, nearly a third below last year and the lowest total since 2022. Demand has a durable base underneath it: the region added about 41,400 jobs over the past year, led by professional and business services, and AT&T is relocating its global headquarters to a 54-acre campus in Plano. When a market that grows this fast stops building, the glut that punished rents begins to clear.
When a fast-growing market stops building, the glut that punished rents starts to clear – and that is usually the moment to look hardest.
That combination, a temporary supply glut clearing into strong underlying demand, with some owners from the cheap-money era now pushed to sell, is exactly the setup we look for outside our hometown. Pricing is constructive without being frothy: the year-to-date median trade is about $175,300 a unit, up 2% from last year, at cap rates near 5.25%, with the mix tilting toward newer mid-rise and high-rise assets[17]. We are underwriting selectively in Dallas-Fort Worth, focused on better-quality assets in submarkets where deliveries are already rolling over, and on situations where a stressed capital structure, not a broken property, is what brings the seller to the table.
Inflation, AI, and the Cost of Everything
Inflation pushed higher rather than easing: after April’s 3.8%, May CPI rose to 4.2% year over year and core ticked up to 2.9%, with shelter still the most stubborn services component[14]. Oil has retreated, but the core print is not, and the story we’re watching for the next several years is structural, and it’s about artificial intelligence.
The AI buildout is becoming a real estate cost story. Hyperscaler capital spending is being revised higher[4], data centers are expected to account for roughly half of U.S. electricity-demand growth through 2030[5], and demand for power infrastructure, electrical equipment, and skilled trades is increasingly competing with conventional development. As one industry analysis put it, even owners who aren’t building data centers are increasingly paying for them[6].
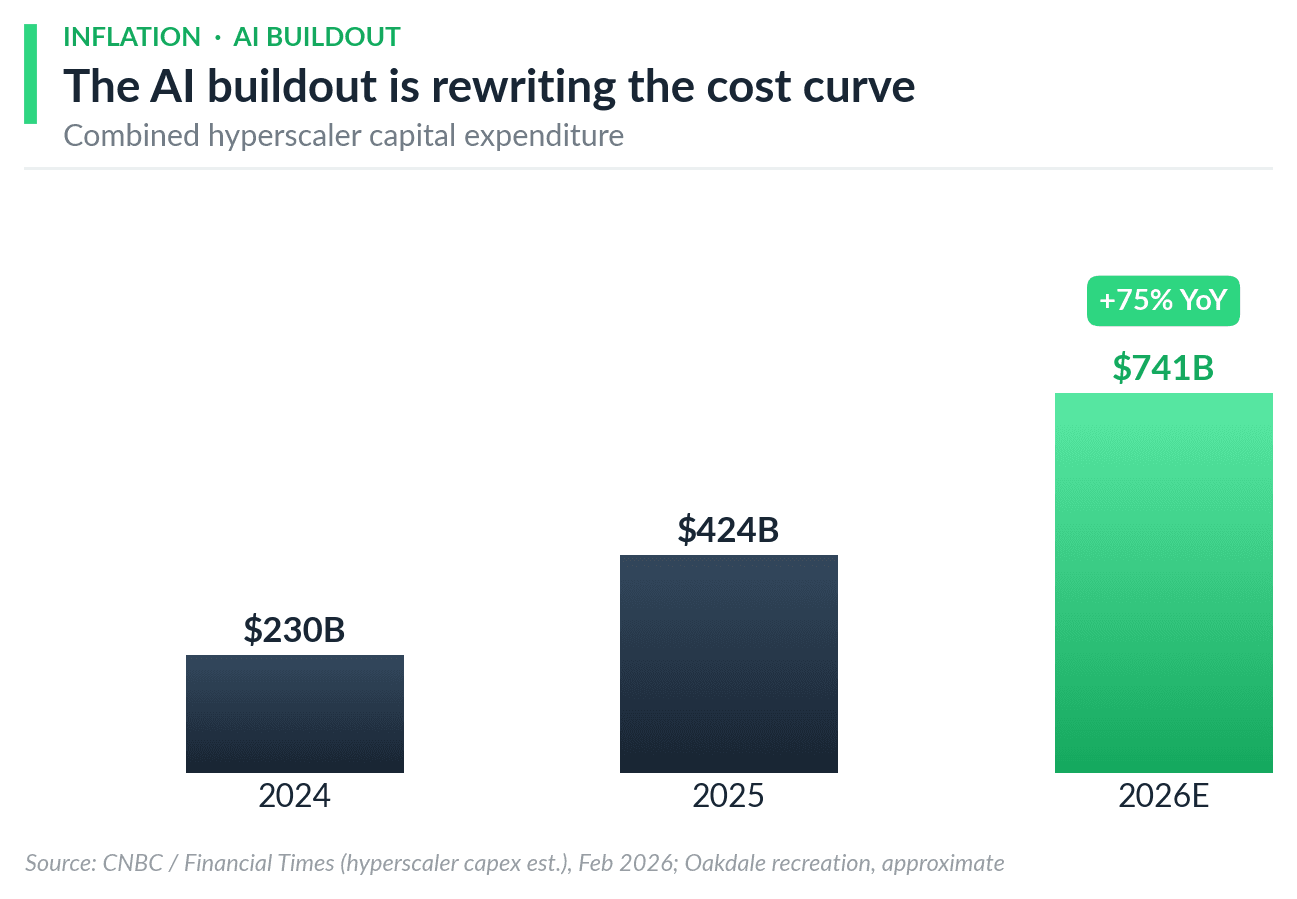
Combined hyperscaler capital expenditure, calendar-year estimates.
Here’s our read: we think the AI buildout is creating near-term cost pressure, while the longer-term growth effect is less settled. The capital, skilled labor, and materials that used to build apartments, schools, and offices are increasingly being drawn toward data centers. We’re seeing it directly: projects that used to pencil are getting squeezed as electrical, mechanical, and labor costs rise while the trades chase hyperscaler budgets. We’re also watching whether the AI capex cycle proves durable.
Fewer new apartments is supportive for in-place assets. But the same cost pressure makes new ground-up development harder to justify, which reinforces our preference for existing assets and adaptive reuse.
Immigration Cuts Both Ways
The administration’s renewed enforcement push matters for apartments on both sides of the ledger, and the two effects don’t cancel cleanly.
On supply, foreign-born workers make up roughly one-third of construction trades, and more in the trades that build apartments, about 57% of drywall and ceiling-tile installers and 53% of roofers[7]. As enforcement ramps and inflows dry up, projects slow and costs rise, with documented delays and penalties reported on active jobs[7]. That tightens the future pipeline, which is supportive for rents in already supply-constrained submarkets.
On demand, the move is bigger and faster. The Census Bureau reports that net international migration peaked at 2.7 million in 2024 and fell to 1.3 million in 2025, and projects a further decline to about 321,000 in 2026 if current trends continue, a historic drop[11]. Immigration is one of the most direct drivers of apartment demand: Apollo estimates household formation could fall by roughly half from 2024 to 2026 under restrictive immigration assumptions[8]. Some operators and analysts report that the pressure is more visible in workforce and Class C housing, where foreign-born households cluster, with some operators in Texas, Florida, and Arizona noting softer leasing and occupancy after ICE activity[9].
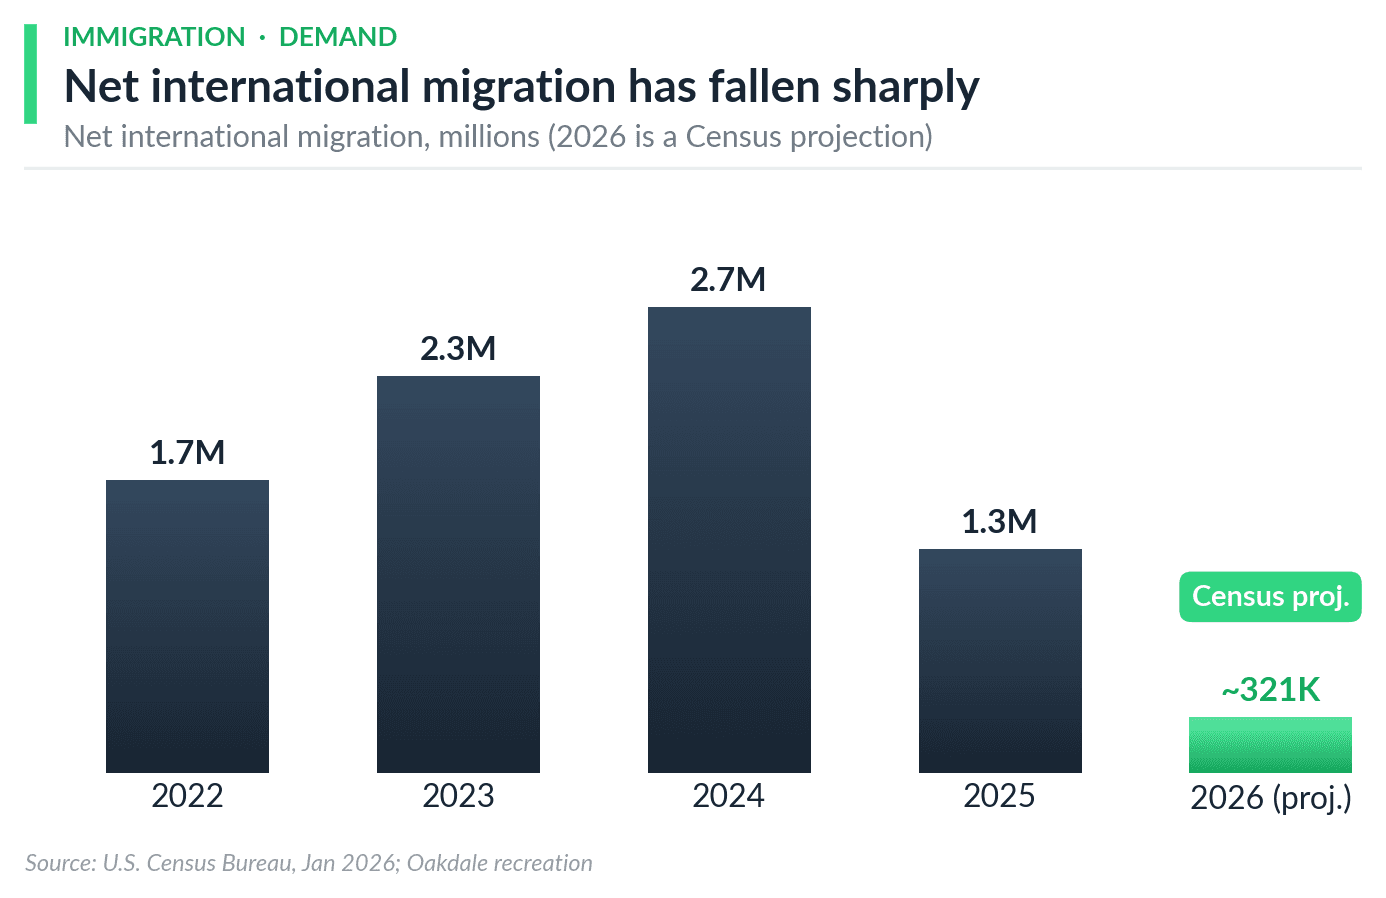
Net international migration climbed to a 2.7M peak in 2024, then fell to 1.3M in 2025, with a projected ~321K in 2026 if current trends continue.
Our read: nationally the supply and demand effects partly offset, but the balance skews negative for the lower-quality end, and the impact varies sharply by market. It reinforces our bias toward supply-constrained submarkets and higher-quality assets with durable, diversified demand, and away from the Class C and deeper workforce product most exposed to the demand loss.
A Housing Bill Lands on the President’s Desk
This month, Congress passed the 21st Century ROAD to Housing Act by a wide margin (Senate 85 to 5 on June 22 and the House 358 to 32 on June 23), representing the most consequential federal housing legislation in years. Rather than subsidize demand, it aims to make housing cheaper and easier to build and to preserve. As of late June, it had cleared both chambers and was expected to be sent to the President’s desk[12].
Several pieces matter for owners and developers. The bill raises federal multifamily mortgage-insurance limits for the first time since 2003, a meaningful update after two decades of construction-cost inflation, and broadens access to affordable mortgage credit, which should widen the financing channel for both new supply and the refinancing still working through the system. It expands a long-running affordable-housing preservation program, cuts development red tape, and modestly eases building-code constraints, all while preserving local control[13]. It also restricts large institutional investors from buying up single-family homes, while carving out purpose-built rental housing so the rule does not choke off new construction. The National Multifamily Housing Council and the National Apartment Association, not easy graders, called the package a win[12].
For us the takeaway is simple: broader, cheaper access to multifamily financing and fewer barriers to building and reusing housing – if it actually becomes law.
For an operator like Oakdale, the relevant levers are financing and friction. Higher mortgage-insurance limits and modernized federal programs should improve the availability and cost of capital for acquisition, refinancing, and conversion, at exactly the moment private credit has turned cautious and the forward rate curve has moved against us. A lighter regulatory load also helps the adaptive-reuse work we favor, where permitting and code friction often decides whether a conversion pencils. We would temper the enthusiasm two ways. First, it is not law yet, and we do not underwrite to bills that can still stall, change in the rulemaking, or die on a procedural fight. Second, the new supply it is designed to unlock is a multi-year story that, if it works, eventually softens rent growth, which is why we keep returning to supply-constrained submarkets and assets we can reposition rather than a bet on broad rent inflation. On balance, if it is enacted, we read it as a modest tailwind for precisely the existing-asset and adaptive-reuse strategy we are pursuing in generally supply-constrained markets.
Closing Thought
June’s message is that the macro picture is hardening rather than easing. Oil retreated but rates are stuck, inflation reaccelerated to 4.2%, the AI buildout is reshaping the cost curve, immigration is squeezing both supply and demand, and a bipartisan housing bill could reshape the supply outlook. But underneath the noise, the opportunity set is getting clearer, and more local.
Our strategy is unchanged and, we’d argue, more relevant than ever. We underwrite to today’s capital costs. We favor supply-constrained submarkets with durable demand. We prefer existing assets and adaptive reuse where new construction is harder to pencil. And we buy capital-structure distress, not fundamental distress. This month, we’re focused closest to home, in Chicago, a market with rising rents, a thinning pipeline, and the deepest local knowledge we have. That’s where we believe we are well positioned over the next twelve months.
As always, please reach out with questions or to discuss what we’re seeing in our active markets.
Sources
Federal Reserve Economic Data (FRED), 10-Year Treasury Constant Maturity Rate (DGS10); U.S. Department of the Treasury, Daily Treasury Par Yield Curve Rates (10-year yield ~4.4% in late June 2026). fred.stlouisfed.org
CoStar Analytics (Adrian Brizuela), “Chicago multifamily transaction volume climbs 34% year over year,” June 26, 2026. costar.com
CoStar Analytics (Adrian Brizuela), “Chicago apartment pipeline remains thin as construction starts slow,” June 26, 2026. costar.com
CNBC, “Tech AI spending approaches $700 billion in 2026, cash taking big hit,” Feb. 6, 2026; and Financial Times analysis of hyperscaler capital-expenditure guidance (combined Amazon, Alphabet, Microsoft, and Meta capex estimated near $725B in 2026, up roughly 77% year over year). cnbc.com
IEA, “Electricity 2026” (data centers expected to account for roughly half of U.S. electricity-demand growth through 2030). iea.org
Construction Owners, “AI Data Center Boom Is Rewriting Construction Economics for Owners Nationwide.” constructionowners.com
Foreign-born share of trades from NAHB / Eye on Housing, “Which States and Construction Trades Depend the Most on Immigrant Workers,” Apr. 2026 (immigrants are about 57% of drywall and ceiling-tile installers and 53% of roofers); project delays and penalties, and the roughly one-third foreign-born share of construction trades (AGC estimate), from Fortune, “Trump’s immigration crackdown is worsening the construction labor shortage,” May 23, 2026. nahb.org · fortune.com
Apollo Academy (Torsten Slok), “Immigration Restrictions Will Lower Household Formation,” Aug. 6, 2025 (household formation could decline about 50% from 2024 to 2026, assuming unauthorized immigration drops to zero); and Multifamily Dive, “How immigration policy, demographic trends affect multifamily: John Burns,” Apr. 6, 2026. apolloacademy.com · multifamilydive.com
Construction Owners, “ICE Raids Weigh on Multifamily Occupancy, Especially Class C Properties.” constructionowners.com
Pensford, “Forward Curve” (1-month Term SOFR), Jan 30, 2026 and Jun 27, 2026. pensford.com
U.S. Census Bureau, “New Population Estimates Show Historic Decline in Net International Migration,” Jan. 27, 2026. census.gov
Multifamily Dive, “Senate, House reach deal on major housing legislation,” June 17, 2026, and “Trump abruptly refuses to sign major bipartisan housing bill,” June 24, 2026 (Senate 85–5; House 358–32; the National Multifamily Housing Council and National Apartment Association called it a win). multifamilydive.com (deal) · multifamilydive.com (vote counts)
Bipartisan Policy Center, “What’s in the 21st Century ROAD to Housing Act,” 2026; U.S. Senate Committee on Banking, Housing, and Urban Affairs (key provisions: first increase in federal multifamily mortgage-insurance limits since 2003; expanded affordable-housing preservation authority; reduced barriers to development). bipartisanpolicy.org
U.S. Bureau of Labor Statistics, Consumer Price Index, April and May 2026 (April 3.8% / 2.8% core; May 4.2% / 2.9% core). bls.gov
Federal Reserve, “Implementation Note,” June 17, 2026 (target range held at 3.50–3.75%). federalreserve.gov
U.S. Energy Information Administration, Europe Brent Spot Price FOB, daily, through Jun 22 ($138.21 peak on Apr 7); ICE Brent front-month futures for Jun 23–26 ($72.60 on Jun 26). eia.gov
Northmarq, “Dallas-Fort Worth Multifamily Market Insights, Q1 2026” (rents and occupancy climb to open 2026); underlying data via Northmarq, RealPage, CoStar, Real Capital Analytics, Green Street, and the U.S. Bureau of Labor Statistics. northmarq.com
