Higher for Longer, for Longer

Oil snapped back on renewed Iran tensions even as inflation finally cooled, the Fed held a fifth straight time while long rates pushed higher, the job market stalled outright, the national apartment market turned a corner, and the housing bill we flagged last month became law without a signature. Here’s what stood out in July, and how we’re reading it.
Oil Snaps Back, Inflation Cools, Rates Climb Anyway
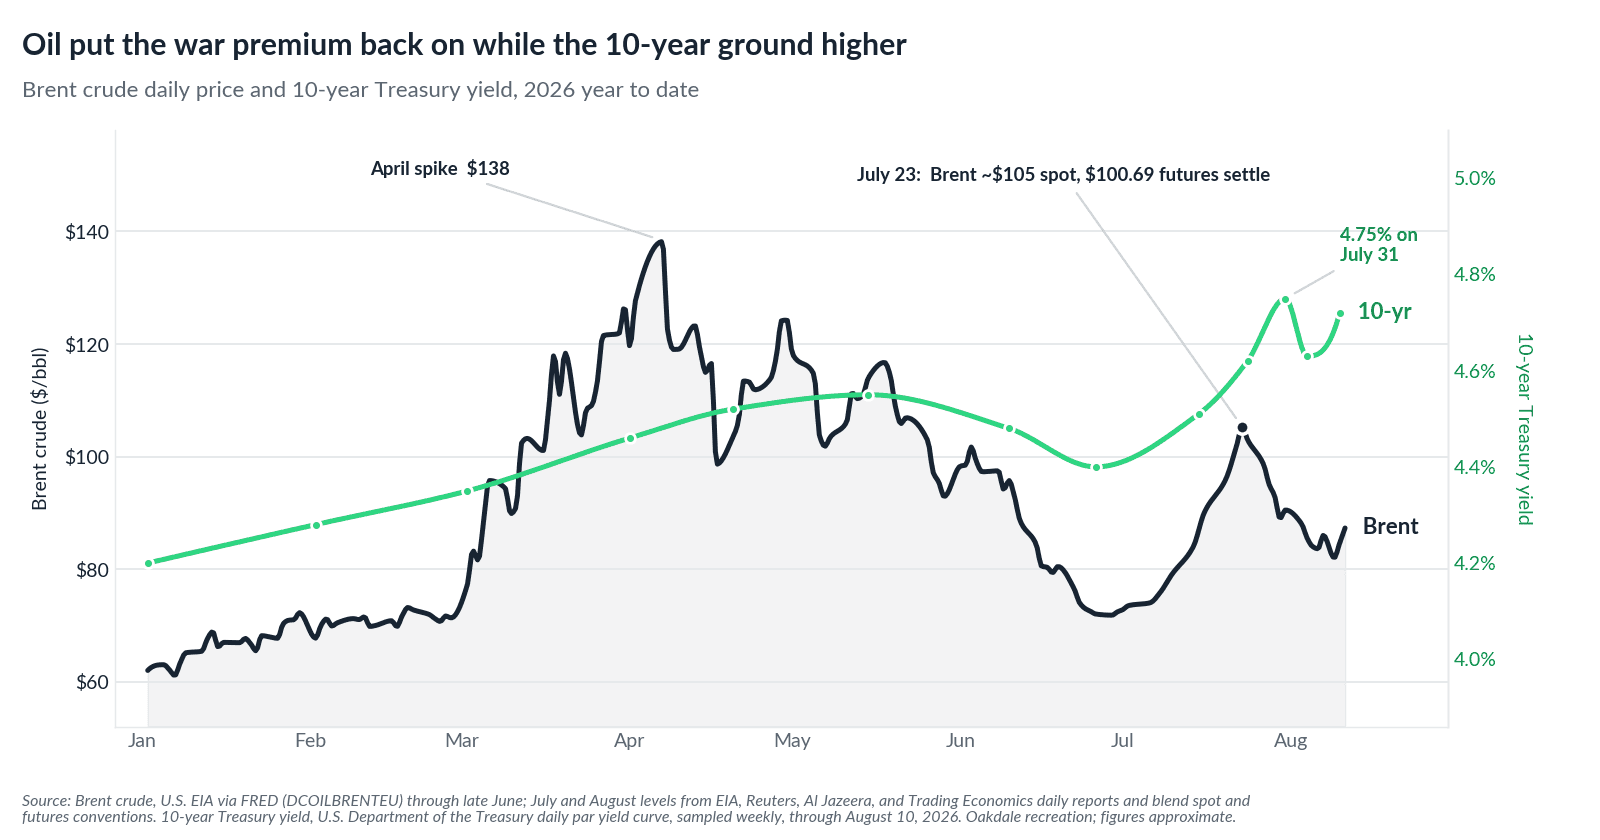
June’s oil retreat did not last. Renewed hostilities between the U.S. and Iran have closed the Strait of Hormuz and put the war premium back into the price. Brent, which had fallen into the low $70s in late June and early July, surged above $100 during the late July escalation, with futures settling at $100.69 on July 23, before finishing the month around $90. It eased into the low $80s in early August, then turned higher again as talks on reopening the strait stalled and Iran attached conditions, trading near $87 on August 11[1]. Energy risk is back in our underwriting conversation, and it is pushing the wrong way.
The surprise was that inflation cooled anyway. The June CPI rose 3.5% year over year, a step down from May’s 4.2% and the first slowdown since January, with core at 2.6%[2]. Much of the headline improvement came outside shelter: at 3.3% year over year, housing inflation remains sticky even as its monthly pace has begun to ease. The labor market, meanwhile, has stalled. July payrolls fell by 23,000, June was revised down to a gain of just 20,000, and unemployment dipped to 4.1%[13]. In an ordinary cycle that combination would hand the Fed a reason to ease. This is not an ordinary cycle.
Against that backdrop, the Federal Reserve held the federal funds rate at 3.50% to 3.75% on July 29, its fifth consecutive hold of 2026, on a divided 9 to 3 vote in which all three dissents wanted rates higher, not lower[3]. Long rates got the message: the 10-year Treasury climbed from about 4.4% in late June to 4.75% by month end, and the 30-year pushed to 5.27%, its highest since 2007[4]. The hold spared floating-rate borrowers a step-up in SOFR, near 3.7%, but offered no relief at the long end, and the rally that followed the weak jobs report did not last: the 10-year was back at 4.72% by August 10[4]. With the forward curve elevated, longer-dated rate caps remain expensive, and any business plan that assumed cheap hedging on a refinancing has to be rebuilt at today’s numbers[12].
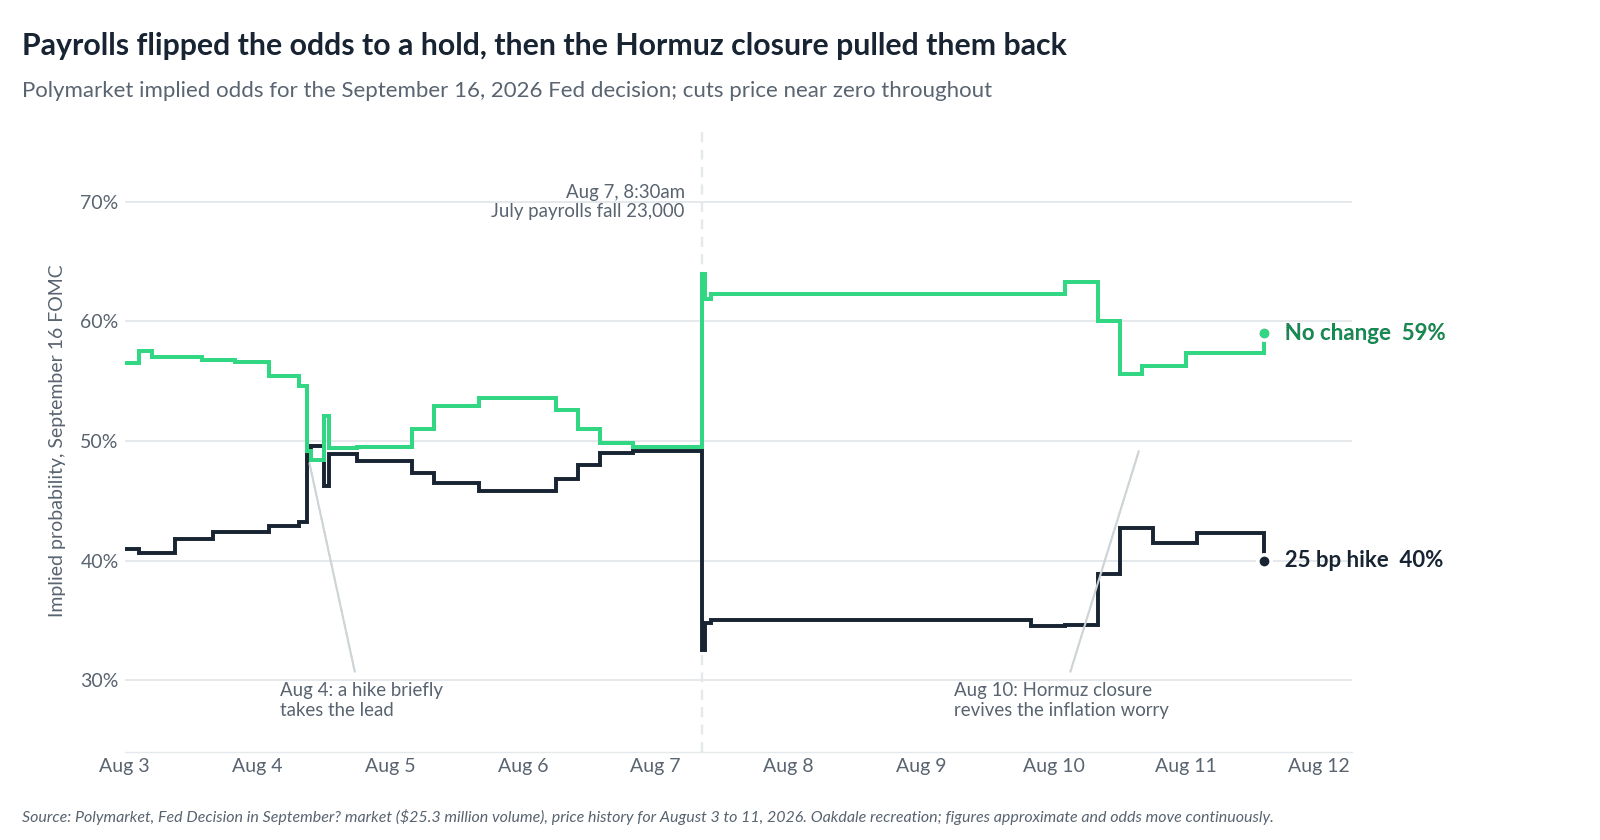
Prediction markets tell the same story with more color. Through early August, Polymarket’s September FOMC contract had a hold and a quarter point hike trading neck and neck, and a hike briefly took the lead on August 4. The payroll release flipped the board in minutes, lifting a hold to about 63%[14], and the Hormuz closure has since pulled it partway back: as of August 11 a hold trades near 59% and a hike near 40%, with cuts priced at almost zero[16]. We treat these odds as sentiment rather than gospel, but the message matches the curve: the live debate is hold versus hike, and nobody is paying for relief.
Inflation cooled, but the cost of capital did not. We keep underwriting to the curve in front of us, not the one we wish for.
The Apartment Market Turns a Corner
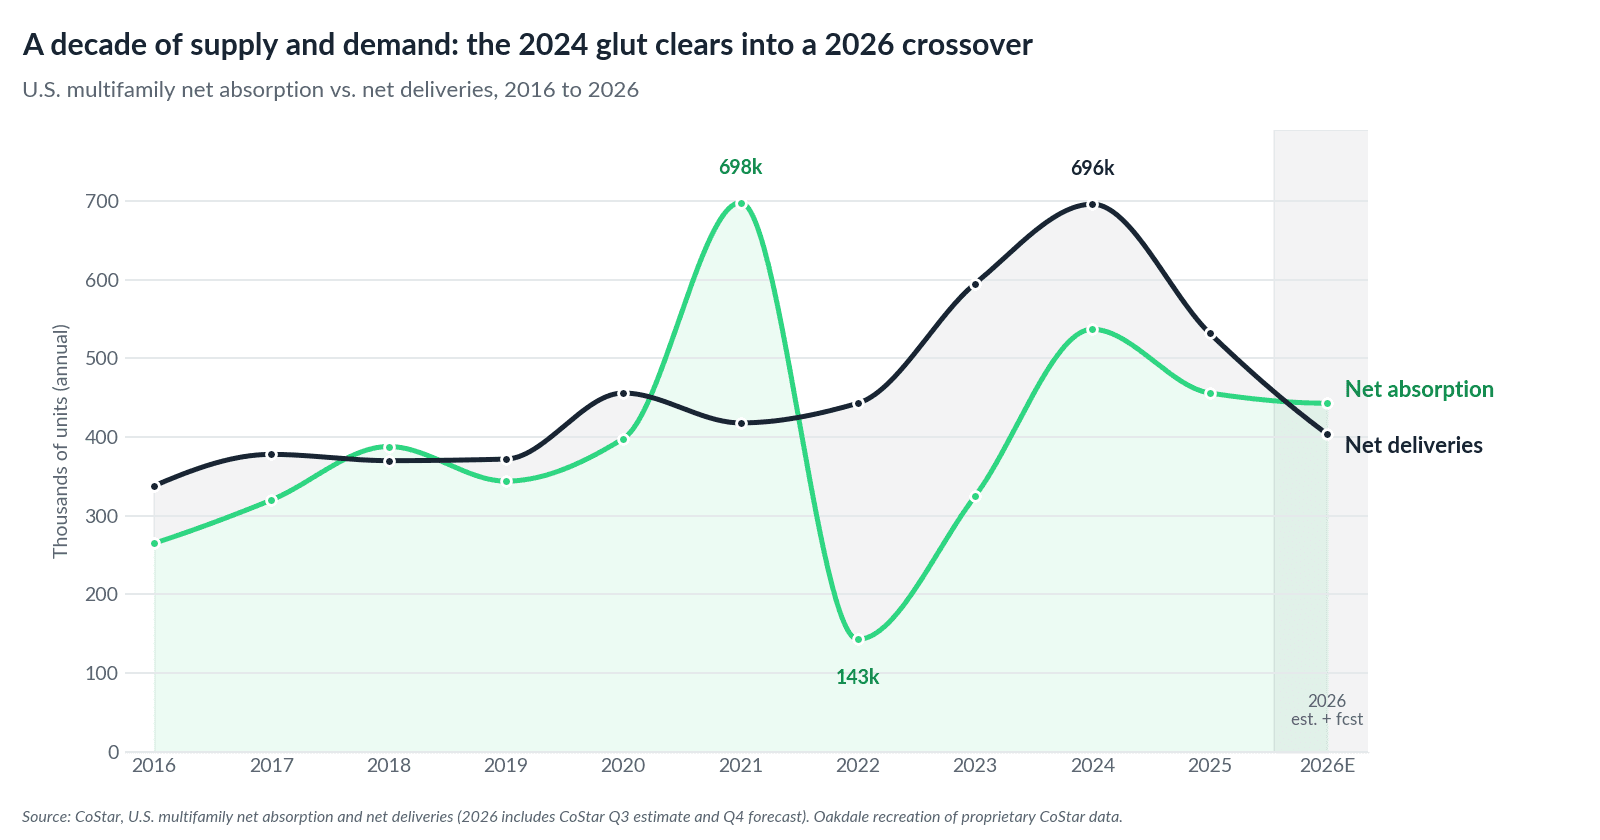
The most encouraging data point of the month was national and structural. Per CoStar, whose 2026 figures include a Q3 estimate and Q4 forecast, net deliveries peaked in 2024 at roughly 700,000 units and are easing toward about 400,000 in 2026, while net absorption has climbed back from its 2022 trough of 143,000 units to roughly 456,000 in 2025[5]. On those estimates, demand is on track to overtake supply in the second half of 2026, and Cushman & Wakefield reports demand had already exceeded new supply on a trailing four-quarter basis by Q2, with national vacancy down 35 basis points to 8.9%.
The sentiment and pricing data agree. NMHC’s quarterly Market Tightness Index rose to 57 from 49, its first reading above neutral since July 2025[6], and per Apartments.com and CoStar the national average rent was about $1,747 in July, up 1.0% year over year, the eighth consecutive month of positive readings[5].
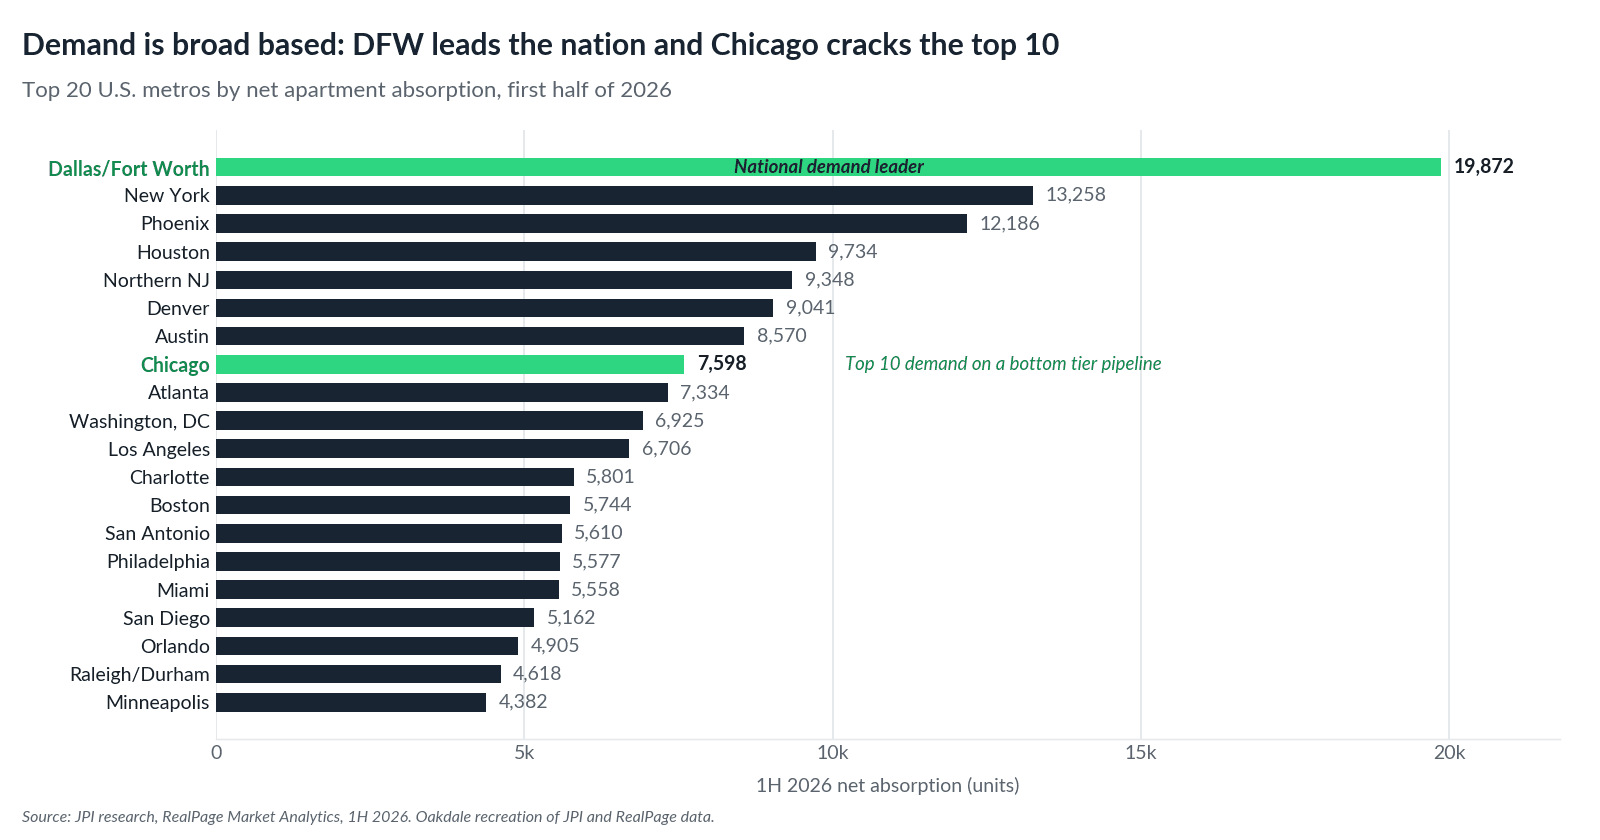
The demand is also landing across the Midwest and Southeast markets where we invest. Per JPI research and RealPage Market Analytics, DFW led the country with nearly 19,900 units absorbed in the first half of 2026, and Chicago ranked eighth at roughly 7,600 units while running one of the thinnest construction pipelines of any large metro, a mismatch we unpack below. The list runs deep through our other regions too, with Atlanta, Charlotte, Raleigh/Durham, Orlando, Miami, and Minneapolis all in the top 20[15].
The oversupply that defined the last two years is clearing. Durable demand is doing the work, and that favors the assets we already like.
Sweet Home Chicago
Last month we wrote about coming home to Chicago, and the data has only strengthened the case. Construction stays structurally thin: per CoStar-derived reporting, about 9,800 units are underway, roughly 1.7% of inventory and well below the national share, and forecasters expect metro vacancy to dip below 5% for the first time in nearly three years[7]. Yardi Matrix put stabilized occupancy at about 96% as of March, comfortably ahead of the national average, with advertised rents up about 3.3% year over year[7]. Tight supply and high occupancy on one side, and values still marked to a higher rate world on the other, make this, in our view, the most attractive window for buying well-located Chicago rental housing in the past decade.
Capital is following the fundamentals: sales reached roughly $1.8 billion through the first four months of the year, about $700 million more than the same stretch of 2025[7], with downtown leading and Class B assets making up about half of transactions[8]. That is exactly where our local knowledge and adaptive-reuse focus give us an edge, and it is not an abstract thesis. In July we were awarded a central Loop residential building out of lender REO, at a basis we believe sits at a deep discount to both replacement cost and the building’s prior valuation: a sound, well-located building brought to market by a broken capital structure rather than broken fundamentals, in the submarket we know best.
Even with a month of positive national headlines, disciplined local sourcing still surfaces exceptional entry points in our own backyard. Our latest central Loop deal is proof.
The ROAD to Housing Act Becomes Law
The bipartisan 21st Century ROAD to Housing Act we flagged last month resolved in an unusual way: after clearing both chambers by wide margins, it became law automatically on July 11 when the President neither signed nor vetoed it within the constitutional window[9].
The substance matters more than the theater. The law raises federal multifamily mortgage-insurance limits for the first time since 2003, broadens access to affordable mortgage credit, expands preservation programs, and trims the permitting and code friction that often decides whether a conversion pencils, all of which improves the financing and feasibility picture for acquisition, refinancing, and conversion at exactly the moment private credit has turned cautious[10]. Its restrictions on large institutional buyers of single-family homes carve out purpose-built rental, so the rule does not choke off new construction. One tempering note: the new supply it is designed to unlock is a multi-year story that, if it works, eventually softens rent growth, which is why we keep returning to supply-constrained submarkets and assets we can reposition. On balance, a modest, durable tailwind for the strategies we are already pursuing.
Broader, cheaper access to multifamily financing and fewer barriers to building and reusing housing, and this time it is actually law.
The Maturity Wall Comes Into View
The other side of higher-for-longer is a refinancing problem now squarely in front of the market. Per MMG Real Estate Advisors, $162 billion of multifamily loans mature in 2026, up 56% from last year, and separately Trepp counts $77 billion of CMBS hard maturities across property types this year, with roughly 39% landing in the fourth quarter[11]. Many of these loans were written in the cheap-money era against rosier rent and rate assumptions, and they are coming due in a 4.75% 10-year environment and a curve that no longer prices relief.
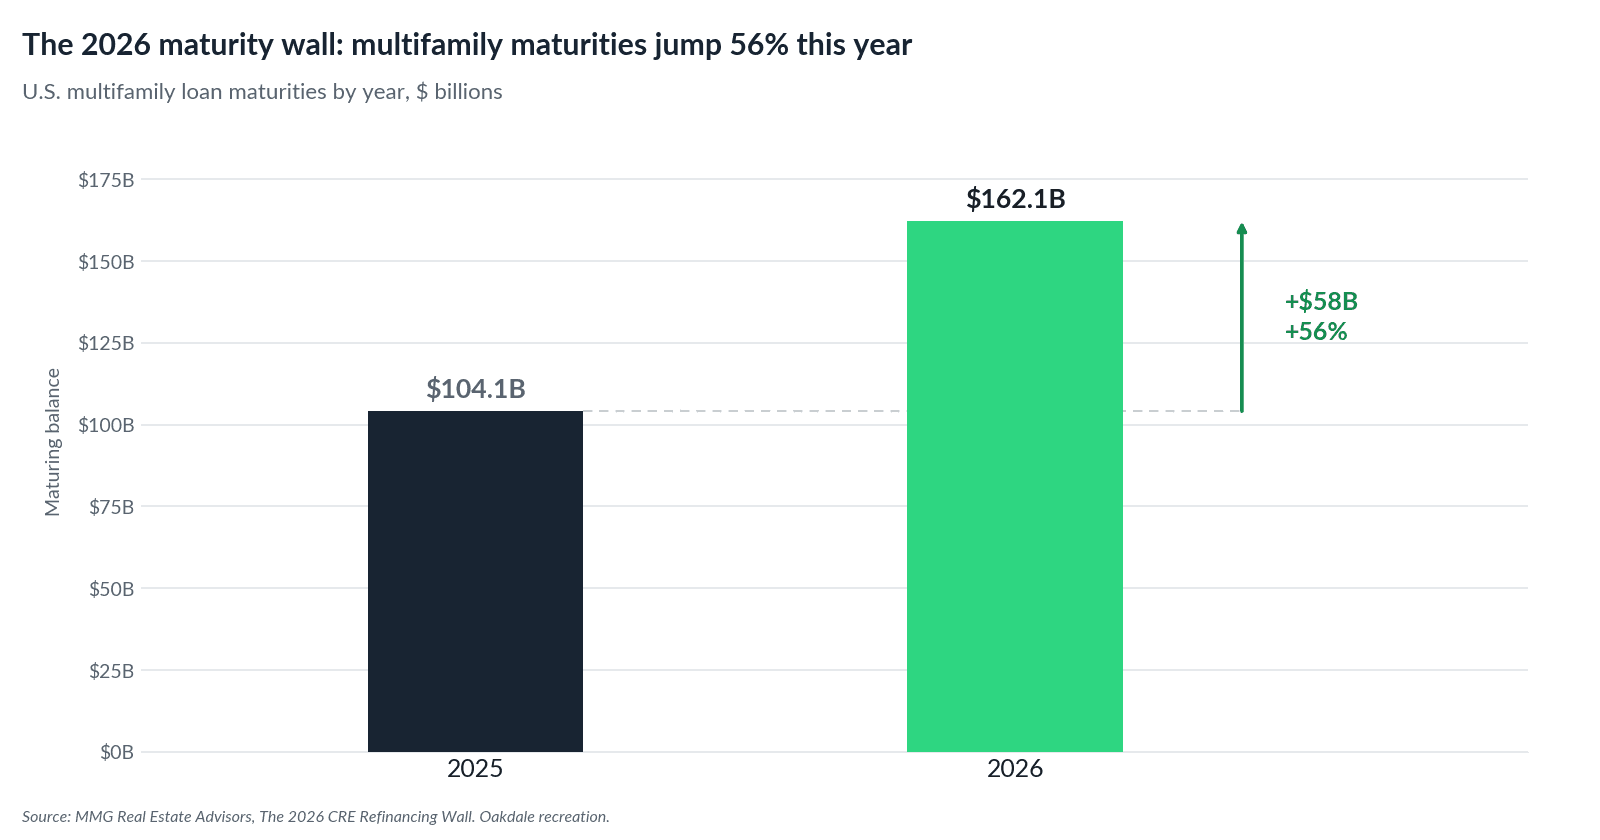
The strain is already visible. The multifamily CMBS delinquency rate climbed to 7.69% in July, returning near its recent highs, with the increase concentrated in a wave of Ohio, Texas, and New York loans that transferred largely on refinancing challenges rather than property performance[11]. That is a capital-structure problem, not a fundamentals problem: good buildings attached to bad balance sheets, owned by sponsors who financed for a world of falling rates that did not arrive. As the fourth-quarter maturities land in a market with limited cheap refinancing, we expect more owners to face a recapitalization or a sale, and we intend to be a disciplined, well-capitalized buyer where the property is sound and only the balance sheet is broken.
We buy capital-structure distress, not fundamental distress. The fall’s refinancing wall is exactly the kind of pressure that brings sellers to the table.
Closing Thought
July’s crosscurrents resolve into a clearer picture than the noise suggests. The cost of capital is still working against us, but inflation cooled, the apartment market turned a corner, our markets kept their edge, and the housing bill became law. Our strategy is unchanged and, we would argue, well matched to this moment: we underwrite to today’s capital costs, we favor supply-constrained submarkets with durable demand, we prefer existing assets and adaptive reuse, and we buy capital-structure distress, not fundamental distress. With the market turning even as rates stay high and a wall of maturities landing this fall, we believe patient, well-capitalized buyers will have the better hand, and we intend to be one across our Midwest and Southeast footprint: closest to home in Chicago, in Dallas/Fort Worth, where our conviction is undiminished and where we have a deal under contract now, and in the other growth markets we continue to underwrite.
As always, please reach out with questions or to discuss what we’re seeing in our active markets.
Sources
Brent crude: U.S. EIA via FRED (DCOILBRENTEU); Reuters, “Oil settles over $100 as Houthi attacks intensify Middle East supply risks,” July 23, 2026 (Brent futures settled at $100.69; EIA spot near $105); a $89.03 futures settlement on July 30 per Reuters and about $92 on the morning of July 31 per Fortune; $84.64 on August 10 per Al Jazeera and about $87 on August 11 per Trading Economics, with the Strait of Hormuz still closed. reuters via investing.com · fortune.com · aljazeera.com · tradingeconomics.com
U.S. Bureau of Labor Statistics, Consumer Price Index, June 2026 (headline 3.5% year over year, core 2.6%; shelter up 3.3%), released July 14, 2026. bls.gov
Federal Reserve, FOMC statement and press coverage, July 29, 2026 (target range held at 3.50%–3.75%; 9–3 vote with three regional-president dissents favoring higher rates). cnbc.com · federalreserve.gov
U.S. Department of the Treasury, Daily Treasury Par Yield Curve (July 31, 2026: 10-year 4.75%, 30-year 5.27%; August 10, 2026: 10-year 4.72%, 30-year 5.25%), and FRED, 10-Year Treasury Constant Maturity Rate (DGS10). home.treasury.gov · fred.stlouisfed.org
CoStar, U.S. multifamily net absorption and net deliveries, quarterly (2022 through Q2 2026 actual, with Q3 2026 estimate and Q4 2026 forecast). Proprietary CoStar data. National vacancy of 8.9% (down 35 bps) and the trailing four-quarter demand crossover from Cushman & Wakefield, U.S. Multifamily MarketBeat, Q2 2026. National average rent of about $1,747 (up 1.0% year over year) from Apartments.com / CoStar, Multifamily Rent Growth Report, July 2026. cushmanwakefield.com
National Multifamily Housing Council, Quarterly Survey of Apartment Market Conditions, July 2026 (Market Tightness Index rose to 57 from 49, first reading above 50 since July 2025). nmhc.org
Yardi Matrix, Chicago Multifamily Market Report, June 2026 (stabilized occupancy about 96% as of March; advertised rents up about 3.3% year over year; sales of $1.8 billion through the first four months), and Matthews / CoStar-derived reporting, Chicago Multifamily Q1 2026 (about 9,800 units underway, roughly 1.7% of inventory; vacancy expected below 5%). matthews.com · yardimatrix.com
Northmarq, “Class B and Class C property sales fuel Chicago’s multifamily investment activity, Q1 2026” (downtown leading; Class B about half of transactions). northmarq.com
GovTrack, H.R. 6644, 21st Century ROAD to Housing Act, and National Low Income Housing Coalition coverage (Senate 85–5, House 358–32; transmitted June 29; became law automatically on July 11, 2026 without the President’s signature). govtrack.us · nlihc.org
Bipartisan Policy Center, “What’s in the 21st Century ROAD to Housing Act,” 2026, and Affordable Housing Finance (first increase in federal multifamily mortgage-insurance limits since 2003; 59 provisions). bipartisanpolicy.org · housingfinance.com
MMG Real Estate Advisors, “The 2026 CRE Refinancing Wall” ($162.1 billion of multifamily maturities in 2026, up 56% from $104.1 billion in 2025); Trepp, “July 2026 CMBS Hard Maturities” ($76.6 billion of CMBS hard maturities across property types, roughly 39% in Q4); and Trepp, CMBS Delinquency Report, July 2026 (multifamily 7.69%, up 46 bps, concentrated in Ohio, Texas, and New York loans; the recent high was 7.71% in April 2026). mmgrea.com · trepp.com · trepp.com
Derivative Logic, “The Fed Sat Still. Financing Costs Did Not.,” Aug. 3, 2026 (1-month Term SOFR about 3.66–3.75%; longer-dated rate caps repricing higher). derivativelogic.com
U.S. Bureau of Labor Statistics, Employment Situation, July 2026 (released August 7, 2026): nonfarm payrolls fell by 23,000 against a roughly 83,000 consensus gain, with June revised down to a 20,000 gain and unemployment at 4.1%. bls.gov
CNBC, “Odds the Fed will hike in September tumble following big July jobs miss,” and Briefs, “Surprise July Jobs Drop Knocks Down Treasury Yields,” both Aug. 7, 2026 (markets shifted back toward a September hold while still pricing meaningful risk of a hike later this year; 10-year about 4.65% and 30-year about 5.21% on August 7). cnbc.com · briefs.co
JPI research and RealPage Market Analytics, top 20 U.S. metros by net apartment absorption, first half of 2026 (Dallas/Fort Worth first at 19,872 units; Chicago eighth at 7,598 units).
Polymarket, “Fed Decision in September?” market for the September 16, 2026 FOMC decision, $25.3 million volume (a hold and a 25 bp hike traded near parity through August 4 to 6; a hold reached about 63% after the August 7 payroll release, then eased to about 59% against a 40% hike by August 11 as the Hormuz closure revived the inflation worry, with cuts near zero). Odds move continuously. polymarket.com
